Beginning of civilizations. All developed some sort of mapping. China distinguished itself be more pictoral and descriptive maps whereas the other civilizations went more for symbols and did not use text to describe the landscape/topology.

Stone Map:
Chinese maps: example of pictoral map, and the stone map with very good representation of the rivers and a mathematical method that is still not understood...


d'Anville:
After centuries with very little exchange of culture China opened up to jesuits and they influenced the development of cartography in China. Emperor Kangxi ordered a complete renewal of Chinese maps from the jesuits. It resulted in the famous atlas d'Anville published 1735 in Paris. Thus Europe also got new improved maps of Asia, China included.
Jesuits explained the theory and methods and the local Chinese performed the necessary surveys. However, Tibet was still off-limits for the Chinese as well as any other foreigners and the nature itself made it also very difficult to produce good maps of the Tibetan plateau.


Above maps found at Hokkaido University Library
Pundits - Hedin:
In the 1800--1900 Central Asia became a strategic geographical politics focus. The British Empire and Russia both closed in on Central Asia and the Tibetan Plateau with the Chinese playing sligtly on te sideline in what is named the Great Game. So the geopolitical significance of Tibet rose dramatically and both parties felt the need to know more about this regions geography. Warfare without maps is impossible. The maps at the time weren't much improved since d'Anville 1735 and it was practically impossible to enter Tibet both for political reasons and the very nature of the place.
Title 1906 Tibet and the surrounding regions
Full Title Tibet and the surrounding regions : compiled from the latest information
Author Sharbau, H. (Henry)
Publication Date 1906
Map of the stipla u bend of Yarlung Tsangpo:
Timber were sent and lives sacrified to map this particular part of the surface Earth.
Title 1906 Tibet and the surrounding regions
Full Title Tibet and the surrounding regions : compiled from the latest information
Author Sharbau, H. (Henry)
Publication Date 1906
Modern Chinese Maps:
Today's process of improving the Chinese maps including Tibet. 5 year plan.
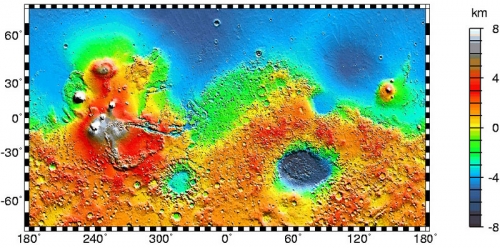
Satellite images: Himalayas - Yarlung Tsangpo and compare with the old maps with incomplete information about the bend.

Space geodesy and space technology have enabled taking good satellite images and hence getting more information about the geography. However, in-situ is still necessary in order to fully exploit the space tools.
GOCE: Height measuring. Mr. everest measuring very precisely early on, but still the accuracy is not good enpought for cliame change research and other applicatons yet to come.

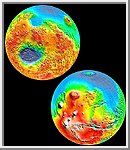
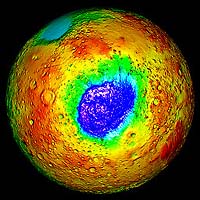
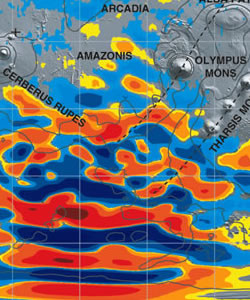
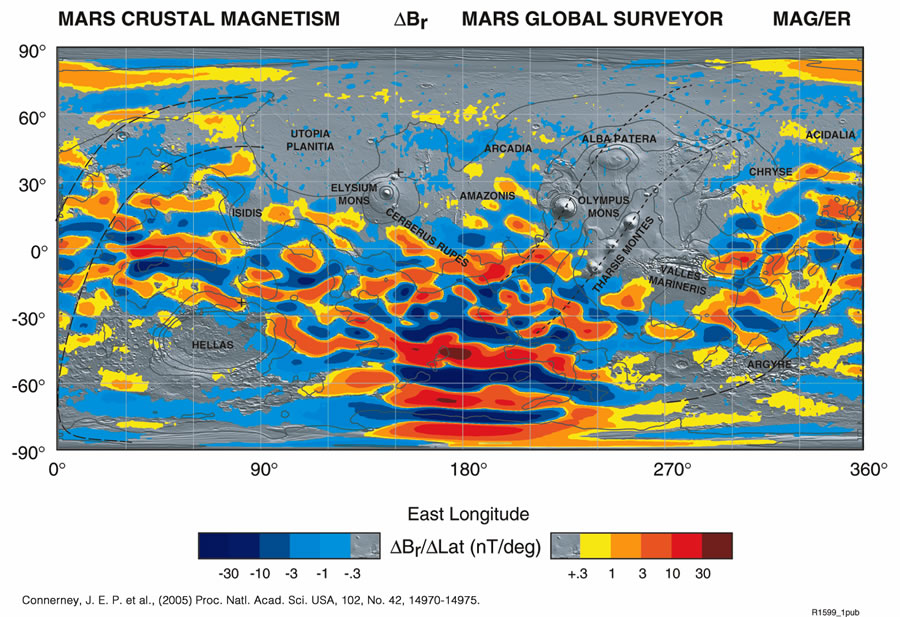
Planetary cartography: Moon, Mars, Exoplanets.


